Category Archives: Technology

Part 1: Setting up Log Analytics on Datadog for QNAP NAS

I recently had the opportunity to join Datadog, a modern monitoring-as-a-service solution provider with a focus on Cloud Native applications. On its own, Datadog has substantial integration for monitoring/tracing/log analytics for enterprise cloud and applications out of the box. Not to toot any horns here, but you can pop by Datadog HQ to sign up for a trial if you need an easy-to-use cloud-based monitoring platform that’s good to go live in 5 minutes.

To get up to speed on log analytics, I wanted to learn how to set up log analytics for custom log sources, which could be a home-grown application or any system which Datadog has not integrated log parsing for yet. Note that this is NOT how most folks would use it in production, since there are already tonnes of out-of-the-box and supported integrations for log parsing/analytics. This is more “corner-case” testing, and to let myself learn how to make custom log parsing work. Also, having had several faults with my QNAP NAS recently which went undiscovered for too long, I thought that would be the perfect target to try this on.

Bit of a disclaimer before going any further: All views here are mine and do not reflect in any way the official position of my employer. Yadda Yadda. Mistakes were very likely made, and are mine. Got it? Good, let’s move on. 🙂

Now, Datadog relies on using a single agent to collect all manner of information, be it metrics, application traces, or logs. This agent can also be configured as a remote syslog collector, used to forward syslogs sent at it to the Datadog cloud for analytics. The set up that I did looked something like the following diagram.

Who’s talking to who?

And, just so we already have the source of custom logs already set up, I configured my QNAP NAS to send all its logs, hopes, fears, anger, failures and frustrations to the Datadog Monitor VM, where my Datadog Agent is installed.
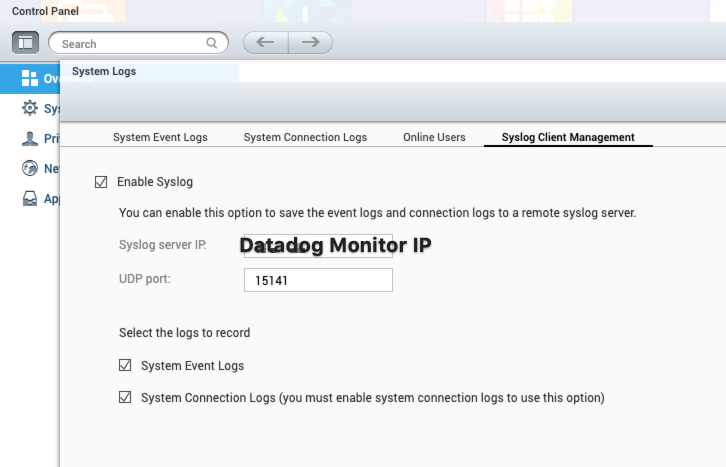
QNAP is set to tell the Datadog Agent about all its problems. Everyone needs a sympathetic ear, and a good doggo to cuddle away their problems. Yes, even a QNAP NAS.

Now that’s done, we’ll deploy the Datadog agent as a Docker container. Using Ubuntu 18.04 as the base OS, install Docker by following the instructions at the Docker Installation Page. For test setups, you can also also run the Docker setup script (not recommended for production) here. Also, remember to install Docker Compose by following the setup instructions here, I’ve got a docker-compose.yaml further down that you can get the agent going in seconds.

To start off, create the following directory structure in your home directory. Use touch and mkdir as you see fit.

~/datadog-monitor
-> docker-compose.yaml
-> datadog-agent
   -> conf.d
      -> qnap.d
         -> conf.yaml

Here are the contents of ~/datadog-monitor/datadog-agent/conf.d/qnap.d/conf.yaml. It configures the agent that it to listen on UDP port 15141, and for any ingested logs to be marked with qnap-nas service and qnap source. I’ve added a number of other tags for easy correlation in my environment later on, but they are optional for the purposes of what we’re trying to do here.

logs:
  type: udp
  port: 15141
  service: qnap-nas
  source: qnap
  tags:
    - cloud_provider:vsphere
    - availability_zone:sgp1
    - env:prod
    - vendor:qnap

Here are the contents of ~/datadog-monitor/docker-compose.yaml. It’s a nice easy way to have Docker Compose bring up the agent container for us and start listening for logs immediately. We’re really setting in the correct environment variables to allow the agent to call home, and also enable logging. You can see we have also allowed the agent to mount and access anything in the ~/datadog-monitor/datadog-agent/conf.d we made earlier.

version: '3.8'
services:
  dd-agent:
    image: 'datadog/agent:7'
    environment:
      - DD_API_KEY=<REDACTED - Refer to your own API Key>
      - DD_LOGS_ENABLED=true
      - DD_LOGS_CONFIG_CONTAINER_COLLECT_ALL=true
      - DD_LOGS_CONFIG_USE_HTTP=true
      - DD_LOGS_CONFIG_COMPRESSION_LEVEL=1
      - DD_AC_EXCLUDE="name:dd-agent"
    volumes:
      - /var/run/docker.sock:/var/run/docker.sock:ro
      - /proc/:/host/proc/:ro
      - /sys/fs/cgroup/:/host/sys/fs/cgroup:ro
      - ./datadog-agent/conf.d:/conf.d:ro
    ports:
      - "15141:15141/udp"
    restart: 'always'

Let make sure we are in the ~/datadog-monitor directory, and run docker-compose.

$ sudo docker-compose up -d
Creating network "datadog-monitor_default" with the default driver
Creating datadog-monitor_dd-agent_1 … done

It’s probably a good idea to verify that the agent container started correctly, and that it is ready to forward logs from the QNAP NAS.

$ sudo docker ps
CONTAINER ID IMAGE COMMAND CREATED STATUS PORTS NAMES
c9d0e3d05441 datadog/agent:7 "/init" 4 seconds ago Up 2 seconds (health: starting) 8125/udp, 8126/tcp, 0.0.0.0:15141->15141/udp datadog-monitor_dd-agent_1

$ sudo docker exec c9d0e3d05441 agent status
===============
Agent (v7.18.1)
Status date: 2020-06-10 13:58:06.211055 UTC
Agent start: 2020-06-10 13:57:44.291976 UTC
Pid: 348
Go Version: go1.12.9
Python Version: 3.8.1
Build arch: amd64
Check Runners: 4
Log Level: info
...
==========
Logs Agent
==========
Sending uncompressed logs in HTTPS to agent-http-intake.logs.datadoghq.com on port 0 
BytesSent: 26753
EncodedBytesSent: 26753
LogsProcessed: 73
LogsSent: 56
...
qnap
----
Type: udp
Port: 15141
Status: OK

Perfect, we’re looking good for now. We’ve got both the log source (QNAP NAS) and the log collector (Datadog agent) set up. In the next post, we will set up custom log parsing for the QNAP NAS.

CLI Command Cheat-sheet for Aruba OS Wi-Fi

I recently put together a cheat-sheet for Aruba OS CLI commands which would be useful for a network team operating a new Aruba Wi-Fi network that I deployed, and thought to share this out.

Feel free to print out or PDF this post, it’s useful if you don’t have access to Internet and need a few quick reminders of what to type like I do. Yes, damn-what-is-that-command-itis is a thing.

CLI Tips and Tricks

<cmd> | include <specific string>
• Filter to display only lines that include a specific string
• Can use comma as an OR operator. Useful to include output headers, for example “show user-table | include IP,—,aa:bb:cc:11:22:33” will show column headers as well as the output line for the specific client.

<cmd> | exclude <specific string>
• Filter to display lines without the specific string

In AOS 8.x (Not in AOS 6.x), It is possible to chain include and exclude filters, for example:
• <cmd> | include <specific string A> | exclude <specific string B>
• <cmd> | include <specific string A> | include <specific string B>
• <cmd> | exclude <specific string A> | exclude <specific string B>
The first displays results for (A AND NOT B), the second (A AND B), and the third (NOT A AND NOT B)

<cmd> | begin <specific string>
• Filter to display only lines from the first occurrence of a specific string

<cmd> [tab]
• Auto-completion, will complete a command if there is only one choice available

<cmd> ?
• Provide a list of commands which match the initial part of the <cmd> string
• Provide a list of parameters usable for the command

no paging
• Disable page breaks, useful for getting a huge amount of output for logging without requiring the administrator to hit [enter]. For example show run, show tech-support etc.
• Return to usual operation by typing “paging”

For commands which generate a lot of output, for example “show run” which will have page breaks, you can type “/” to search for a specific word, and “n” to search for the next occurrence. Similar to Linux “less” command.

Generally Useful Commands

show ap database / show ap database long
• shows details on all APs that the controller is aware of
• “long” includes AP Wired MAC and Serial Number

show ap active
• Shows APs which are currently Actively terminated on the controller, and summary of RF operating parameters

show switches (On Master Controller, if using Master-Local architecture)
• Shows if all configuration has been successfully pushed down to the controllers
• Shows OS versions of all of the controllers

show database synchronize (From Master Controller, if using Master-Local architecture)
• Validate that Master has successfully replicated configuration and DBs to the Backup Master

show master-redundancy (From Master Controller, if using Master-Local architecture)
• Show current state of master redundancy, i.e. who’s Master and who’s Backup.

apboot <various parameters, use tab to expand>
• Reboot specific APs or a set of APs.
• Useful if you don’t have access to PoE settings of the switchport
• Applicable only on the controller where AP is terminated

User Diagnostic – To be run on controller where users are present

show user-table (option to add “| include <client MAC>” to drill down)
• Shows general connectivity of the client, including IP address. If a client did not receive DHCP IP address, this entry will NOT exist. Hence…

show station-table mac <client MAC>
• Shows if the client (802.11 parlance calls this a Station or STA) is even associated to the network. If it is associated, but there is no entry on user-table, investigate role policies (Is DHCP blocked?) and DHCP server.

show user mac <client MAC>
• Shows VERBOSE details about a connected client. Use “| include” to narrow down for example:
o show user mac <client MAC> | include VLAN
o show user mac <client MAC> | include ACL
o show user mac <client MAC> | include SNR
o show user mac <client MAC> | include IP
o show user mac <client MAC> | include DHCP

(config) # logging level debugging user-debug aa:bb:cc:11:22:33
• Turns on logging for a specific client in the global configuration mode
• If not specified, and no other user-debugs exist, “show auth-tracebuf” will show for all user entries – Mind that the log buffer is not very long and you could miss what you’re looking for
• If not specified, and other user-debugs exist, will not show output for what is not explicitly specified.
• Remember to remove this (and any other debug commands) at the end of the debug session.

show auth-tracebuf (option to “ | include <client-mac>”)
• Show auth logs for the client (refer logging level debugging user-debug).
• Shows EAP transactions and interaction between client, controller and RADIUS.
• First thing to check if clients cannot connect – Look for Rejects!
• Follow up by checking for client auth failure reason at ClearPass Tracker

show ap remote debug mgmt-frames ap-name <ap-name> client-mac <client-mac>
• Shows the 802.11 management frame exchanges between the client and AP
• Useful to see association/authentication exchanges in the air and complements “show auth-tracebuf” for troubleshooting EAP exchange problems
• Also shows explicit deauthentication/disconnection exchanges

show ap arm history ap-name <AP Name>
• Shows AP ARM history – including channel and power changes over time

show ap arm client-match history client-mac <client MAC>
• Shows Client Match history for a specific client – Answers whether client were moved by ClientMatch (change AP, change radio band), and for what reason.

Data Path / Security Diagnostic

show rights
• Shows summarized list of all user roles in existence

show rights <role name>
• Shows policies, VLANs associated for a specific role

show datapath session table <client IP>
• Shows all concurrent connections and associated flags
• Each session creates two entries – Ingress and Egress entries, with “C” flag indicating the client initiating the connection
• Look out for zero bytes entries, missing return state entries, or “D” flag which could indicate firewall blocking the connections

Miscellaneous

show vrrp
• Shows VRRP information

show ip interface brief
• Shows IP interfaces

show controller-ip
• Shows which is the primary IP used by the controller, usually used by management (Master, AirWave, SNMP, RADIUS etc, unless explicitly specified otherwise.)

Building a Remote Door Lock with AWS IoT

I thought it’d be fun to build an IoT Remote Door lock and figure out how to do something a bit more interesting with AWS IoT Core at the same time.

Now, I’ve played a bit with Amazon’s IoT Button for fun, and built an ESP8266-based temperature sensor using Mongoose OS and a DHT22 temp sensor. Building a remote controlled door latch would be an interesting way to learn how to extend the capabilities of both a bit more. Let’s diagram out our Evil-Plan™ so there’s a clear idea of what we will be building.

So here’s the Evil-Plan™…

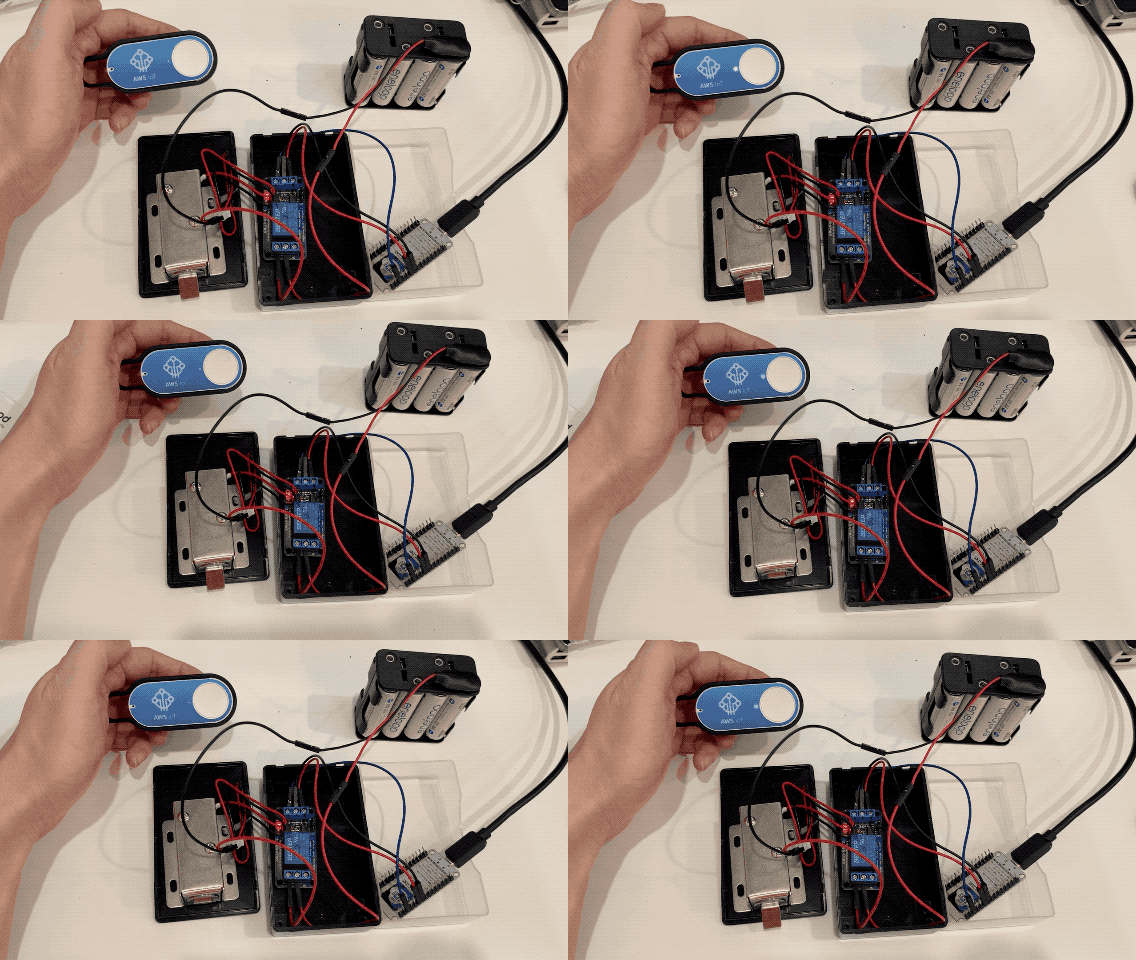
Roughly translated, the IoT Button publishes a “ButtonPress” event to its MQTT topic on AWS IoT Core when it is pressed. This message is propagated to a listening ESP8266 micro-controller. The micro-controller then flips the input to a relay which controls an electronic latch, causing it to either lock or unlock, depending on the previous state. In theory, it seems pretty sound, but there’s only one way to find out if this works.

Let’s get started by standing up the micro-controller.

Preparing and Building Mongoose OS Firmware

The brains of the Remote Lock is an Espressif ESP8266 NodeMCU micro-controller board with Mongoose OS. It’s probably the easiest way to get an IoT device working with AWS IoT, and Amazon even has a great tutorial on getting this to work.

To build a Mongoose OS application, the file hierarchy has to be set up correctly. The files “mos.yml” and “init.js” are created and placed into the following hierarchy structure.

remote-lock/
remote-lock/mos.yml
remote-lock/fs/
remote-lock/fs/init.js

This is the contents of remote-lock/mos.yml. The “mos.yml” metafile describes the overall application, including dependencies and dependency versions. The “libs” section is especially important to note; It is here that the needed libraries for the app are listed, without which some functionalities will not work.

author: Lim Wei Chiang
description: AWS Remote lock
# arch: PLATFORM
version: 1.0
manifest_version: 2019-08-10

libs_version: ${mos.version}
modules_version: ${mos.version}
mongoose_os_version: ${mos.version}

tags:
  - js
  - aws
  - mqtt

filesystem:
  - fs

libs:
  # common mgos libs
  - origin: https://github.com/mongoose-os-libs/boards
  - origin: https://github.com/mongoose-os-libs/ca-bundle
  - origin: https://github.com/mongoose-os-libs/i2c
  - origin: https://github.com/mongoose-os-libs/rpc-service-config
  - origin: https://github.com/mongoose-os-libs/rpc-service-fs
  - origin: https://github.com/mongoose-os-libs/rpc-uart
  - origin: https://github.com/mongoose-os-libs/spi

  # libs necessary for the current app
  - origin: https://github.com/mongoose-os-libs/aws
  - origin: https://github.com/mongoose-os-libs/mjs
  - origin: https://github.com/mongoose-os-libs/wifi
  - origin: https://github.com/mongoose-os-libs/mqtt

The following is the Javascript code of the main execution thread, it goes into remote-lock/fs/init.js. The “fs” directory holds all the files that need to be loaded into flash memory of the ESP8266. The code subscribes the ESP8266 to an MQTT topic, and toggles the signal on a GPIO pin when it receives an MQTT message. This in turn controls a relay to toggle the the electronic latch between a locked and unlocked state.

/*** Global Constants ***/
let SYS_STARTUP_DELAY = 1; // in seconds
let LOCK_CTL_GPIO = 4; /* Pin D2 on the ESP8266 (NodeMCU Layout) board */
let MQTT_PATH = "remote-lock";
let DEVICE_ID = Cfg.get('device.id');
let MQTT_TOPIC = MQTT_PATH + "/" + DEVICE_ID;

/*** Global Variables ***/
let lock_state = 0; // , '0' = Locked, '1' = Unlocked

function mqttSubHandler(conn, topic, msg){
  print("MQTT Received:");
  print(topic);
  print(msg);

  if (lock_state === 0)
  {
    toggleUnlock();
  }
  else if (lock_state === 1) {
    toggleLock();
  }
}

function toggleLock(){
  lock_state = 0;
  GPIO.write(LOCK_CTL_GPIO, lock_state);
}

function toggleUnlock(){
  lock_state = 1;
  GPIO.write(LOCK_CTL_GPIO, lock_state);
}

/*** Main ***/
Sys.usleep(SYS_STARTUP_DELAY * 1000000); // Delay startup in usecs
GPIO.set_mode(LOCK_CTL_GPIO, GPIO.MODE_OUTPUT); // Set GPIO pin to use, and method
MQTT.sub(MQTT_TOPIC, mqttSubHandler); // Subscribe for event

We use the files above to build the firmware for the micro-controller. This step uses the Mongoose OS ‘mos’ command, usually at ~/.mos/bin/mos. While in remote-lock/, build the firmware using the ‘mos build’ command.

$ ~/.mos/bin/mos build --platform ESP8266
 Connecting to https://mongoose.cloud, user test
 Uploading sources (2261 bytes)
 Firmware saved to ~/.mos/remote-lock/build/fw.zip

Flashing Firmware and Connecting the Remote Lock to Internet

Once the firmware finishes building, it needs to be flashed to the board. I have my board connected via USB to a MacBook. While in remote-lock/, flash the firmware using the ‘mos flash’ command.

$ ~/.mos/bin/mos flash
 Loaded remote-lock/esp8266 version 1.0 (20190929-145628)
 Using port /dev/cu.SLAB_USBtoUART
 Opening /dev/cu.SLAB_USBtoUART @ 115200…
 Connecting to ESP8266 ROM, attempt 1 of 10…
   Connected, chip: ESP8266EX
 Running flasher @ 921600…
   Flasher is running
 Flash size: 4194304, params: 0x024f (dio,32m,80m)
 Deduping…
      2320 @ 0x0 -> 0
    262144 @ 0x8000 -> 86016
       128 @ 0x3fc000 -> 0
 Writing…
      4096 @ 0x7000
      8192 @ 0x8000
      4096 @ 0x14000
     73728 @ 0x19000
    737280 @ 0x100000
      4096 @ 0x3fb000
 Wrote 827408 bytes in 9.46 seconds (683.09 KBit/sec)
 Verifying…
      2320 @ 0x0
      4096 @ 0x7000
    262144 @ 0x8000
    733200 @ 0x100000
      4096 @ 0x3fb000
       128 @ 0x3fc000
 Booting firmware…
 All done!

That looks good! Next, lets set up Wi-Fi connectivity so the ESP8266 can reach the Internet.. I’ve substituted my SSID and Wi-Fi password in the example, of course. 😄

$ ~/.mos/bin/mos wifi myWiFiSSID 'WiFiPassword'
 Using port /dev/cu.SLAB_USBtoUART
 Getting configuration…
 Setting new configuration…

Once it’s online, we’ll need to register the ESP8266 with Amazon AWS. IoT Core has a built in Certificate Authority (CA) of its own, which is useful to generate certificates for IoT devices quickly. Mongoose OS makes this even easier with its built-in enrolment feature that “automagically” registers, generates and uploads SSL certificates, and links a default “allow-all” IoT policy to the ESP8266. Let’s enrol the ESP8266 with the “mos aws-iot-setup” function.

$ ~/.mos/bin/mos aws-iot-setup --aws-region us-east-1
 Using port /dev/cu.SLAB_USBtoUART
 AWS region: us-east-1
 Connecting to the device…
   esp8266 62019422AB37 running remote-lock
...
 Generating ECDSA private key
 Generating certificate request, CN: esp8266_22AB37
 Asking AWS for a certificate…
 Certificate info:
   Subject : CN=esp8266_22AB37
   Issuer  : OU=Amazon Web Services O=Amazon.com Inc. L=Seattle ST=Washington C=US
   Serial  : [REMOVED]
   Validity: [REMOVED]
   Key algo: ECDSA
   Sig algo: SHA256-RSA
   ID      : [REMOVED]
   ARN     : [REMOVED]
 AWS region: us-east-1
 Attaching policy "mos-default" to the certificate…
 2019/09/29 23:21:02 This operation, AttachPrincipalPolicy, has been deprecated
 Attaching the certificate to "esp8266_22AB37"…
 Writing certificate to aws-esp8266_22AB37.crt.pem…
 Uploading aws-esp8266_22AB37.crt.pem (1141 bytes)…
 Writing key to aws-esp8266_22AB37.key.pem…
 Uploading aws-esp8266_22AB37.key.pem (227 bytes)…
 Updating config:
   aws.thing_name = 
   mqtt.enable = true
   mqtt.server = [REMOVED].us-east-1.amazonaws.com:8883
   mqtt.ssl_ca_cert = ca.pem
   mqtt.ssl_cert = aws-esp8266_22AB37.crt.pem
   mqtt.ssl_key = aws-esp8266_22AB37.key.pem
 Setting new configuration…

Right, so that should work, and we need to tie this to the AWS IoT Button.

Glueing Everything Together

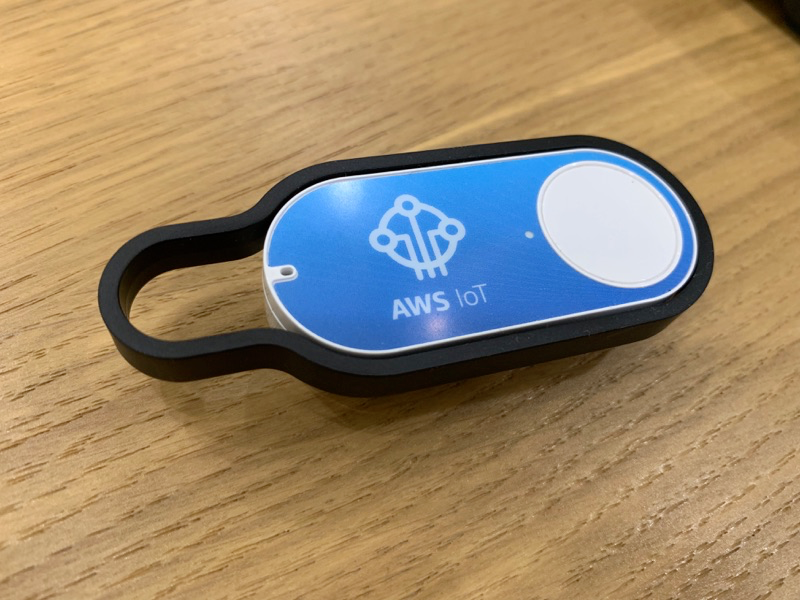
Old trusty AWS IoT Button. It’s Wi-Fi connected too! (I love Wi-Fi and I cannot lie…)

I’ll be honest, because of my job as a Wi-Fi engineer, I love things that connect to Wi-Fi. The AWS IoT Button is just one of those things. This has already been on-boarded previously, so I really just need to assign an action to the button when it is pressed.

Here, the Action Policy at AWS IoT is set to match and redirect any published MQTT messages from the IoT Button sent to “thing/AWS-Button-AB12” to the topic “remote-lock/esp8266_22AB37”. This is the topic being subscribed to by the ESP8266 micro-controller, which then uses any received message as a trigger to lock or unlock.

Match and Republish MQTT messages from the IoT Button

It’s fairly simple, and could actually be simplified further by having the Remote Door Lock subscribe directly to the “thing/AWS-Button-AB12” topic. I kept the two MQTT topics separate in case I wanted to easily attach a trigger other than the IoT Button later.

Testing, One, Two, Three…

Now for a quick prayer, and button click…

It’s alive….

Voila! A quick press of the IoT button toggles the Remote Latch, and allows me to lock or unlock any door that this is installed on. In fact, I’ll probably install it on a locker I have at work. 🙂