I recently had the opportunity to join Datadog, a modern monitoring-as-a-service solution provider with a focus on Cloud Native applications. On its own, Datadog has substantial integration for monitoring/tracing/log analytics for enterprise cloud and applications out of the box. Not to toot any horns here, but you can pop by Datadog HQ to sign up for a trial if you need an easy-to-use cloud-based monitoring platform that’s good to go live in 5 minutes.
To get up to speed on log analytics, I wanted to learn how to set up log analytics for custom log sources, which could be a home-grown application or any system which Datadog has not integrated log parsing for yet. Note that this is NOT how most folks would use it in production, since there are already tonnes of out-of-the-box and supported integrations for log parsing/analytics. This is more “corner-case” testing, and to let myself learn how to make custom log parsing work. Also, having had several faults with my QNAP NAS recently which went undiscovered for too long, I thought that would be the perfect target to try this on.
Bit of a disclaimer before going any further: All views here are mine and do not reflect in any way the official position of my employer. Yadda Yadda. Mistakes were very likely made, and are mine. Got it? Good, let’s move on. 🙂
Now, Datadog relies on using a single agent to collect all manner of information, be it metrics, application traces, or logs. This agent can also be configured as a remote syslog collector, used to forward syslogs sent at it to the Datadog cloud for analytics. The set up that I did looked something like the following diagram.

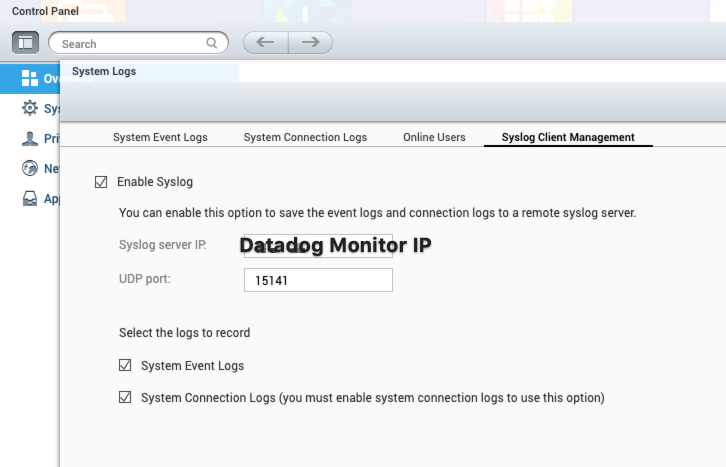
And, just so we already have the source of custom logs already set up, I configured my QNAP NAS to send all its logs, hopes, fears, anger, failures and frustrations to the Datadog Monitor VM, where my Datadog Agent is installed.
Now that’s done, we’ll deploy the Datadog agent as a Docker container. Using Ubuntu 18.04 as the base OS, install Docker by following the instructions at the Docker Installation Page. For test setups, you can also also run the Docker setup script (not recommended for production) here. Also, remember to install Docker Compose by following the setup instructions here, I’ve got a docker-compose.yaml further down that you can get the agent going in seconds.
To start off, create the following directory structure in your home directory. Use touch and mkdir as you see fit.
~/datadog-monitor
-> docker-compose.yaml
-> datadog-agent
   -> conf.d
      -> qnap.d
         -> conf.yaml
Here are the contents of ~/datadog-monitor/datadog-agent/conf.d/qnap.d/conf.yaml. It configures the agent that it to listen on UDP port 15141, and for any ingested logs to be marked with qnap-nas service and qnap source. I’ve added a number of other tags for easy correlation in my environment later on, but they are optional for the purposes of what we’re trying to do here.
logs:
  type: udp
  port: 15141
  service: qnap-nas
  source: qnap
  tags:
    - cloud_provider:vsphere
    - availability_zone:sgp1
    - env:prod
    - vendor:qnap
Here are the contents of ~/datadog-monitor/docker-compose.yaml. It’s a nice easy way to have Docker Compose bring up the agent container for us and start listening for logs immediately. We’re really setting in the correct environment variables to allow the agent to call home, and also enable logging. You can see we have also allowed the agent to mount and access anything in the ~/datadog-monitor/datadog-agent/conf.d we made earlier.
version: '3.8'
services:
  dd-agent:
    image: 'datadog/agent:7'
    environment:
      - DD_API_KEY=<REDACTED - Refer to your own API Key>
      - DD_LOGS_ENABLED=true
      - DD_LOGS_CONFIG_CONTAINER_COLLECT_ALL=true
      - DD_LOGS_CONFIG_USE_HTTP=true
      - DD_LOGS_CONFIG_COMPRESSION_LEVEL=1
      - DD_AC_EXCLUDE="name:dd-agent"
    volumes:
      - /var/run/docker.sock:/var/run/docker.sock:ro
      - /proc/:/host/proc/:ro
      - /sys/fs/cgroup/:/host/sys/fs/cgroup:ro
      - ./datadog-agent/conf.d:/conf.d:ro
    ports:
      - "15141:15141/udp"
    restart: 'always'
Let make sure we are in the ~/datadog-monitor directory, and run docker-compose.
$ sudo docker-compose up -d
Creating network "datadog-monitor_default" with the default driver
Creating datadog-monitor_dd-agent_1 … done
It’s probably a good idea to verify that the agent container started correctly, and that it is ready to forward logs from the QNAP NAS.
$ sudo docker ps
CONTAINER ID IMAGE COMMAND CREATED STATUS PORTS NAMES
c9d0e3d05441 datadog/agent:7 "/init" 4 seconds ago Up 2 seconds (health: starting) 8125/udp, 8126/tcp, 0.0.0.0:15141->15141/udp datadog-monitor_dd-agent_1

$ sudo docker exec c9d0e3d05441 agent status
===============
Agent (v7.18.1)
Status date: 2020-06-10 13:58:06.211055 UTC
Agent start: 2020-06-10 13:57:44.291976 UTC
Pid: 348
Go Version: go1.12.9
Python Version: 3.8.1
Build arch: amd64
Check Runners: 4
Log Level: info
...
==========
Logs Agent
==========
Sending uncompressed logs in HTTPS to agent-http-intake.logs.datadoghq.com on port 0
BytesSent: 26753
EncodedBytesSent: 26753
LogsProcessed: 73
LogsSent: 56
...
qnap
----
Type: udp
Port: 15141
Status: OK
Perfect, we’re looking good for now. We’ve got both the log source (QNAP NAS) and the log collector (Datadog agent) set up. In the next post, we will set up custom log parsing for the QNAP NAS.